

Build 10x products in minutes by chatting with AI - beyond just a prototype.
Victory Charts are composable React components for building interactive data visualizations. Designed by Formidable, Victory provides an easy-to-use yet powerful interface for crafting sophisticated charts with React. This guide delves into the intricacies of Victory Charts, highlighting their compatibility with React and React Native through the Victory Native extension.
We'll explore the essentials of your first Victory component, how to add Victory to your projects, and the seamless experience its identical API offers across platforms.
Victory Charts represent a cornerstone in the React ecosystem for crafting data visualizations. They encapsulate the complexity of d3-based charts into composable React components , making integrating sophisticated charts into your React applications straightforward. Whether you're working on a web project with React or a mobile app with React Native, Victory's identical API ensures a uniform development experience.
Installing Victory is as simple as running an npm install command. For a web project, you would typically use React DOM, while for a React Native project, Victory Native is the go-to solution.
npm install victory --save
For React Native projects, you would install Victory Native:
npm install victory-native react-native-svg --save
To utilize Victory in your project, you must first import React along with the Victory components you plan to use. This is a crucial step to access the rich functionalities of Victory within your React or React Native app.
import React from 'react'; import { VictoryPie, VictoryChart, VictoryAxis } from 'victory';
For a Victory Native project, the import statement would slightly differ:
import { VictoryPie, VictoryChart, VictoryAxis } from 'victory-native';
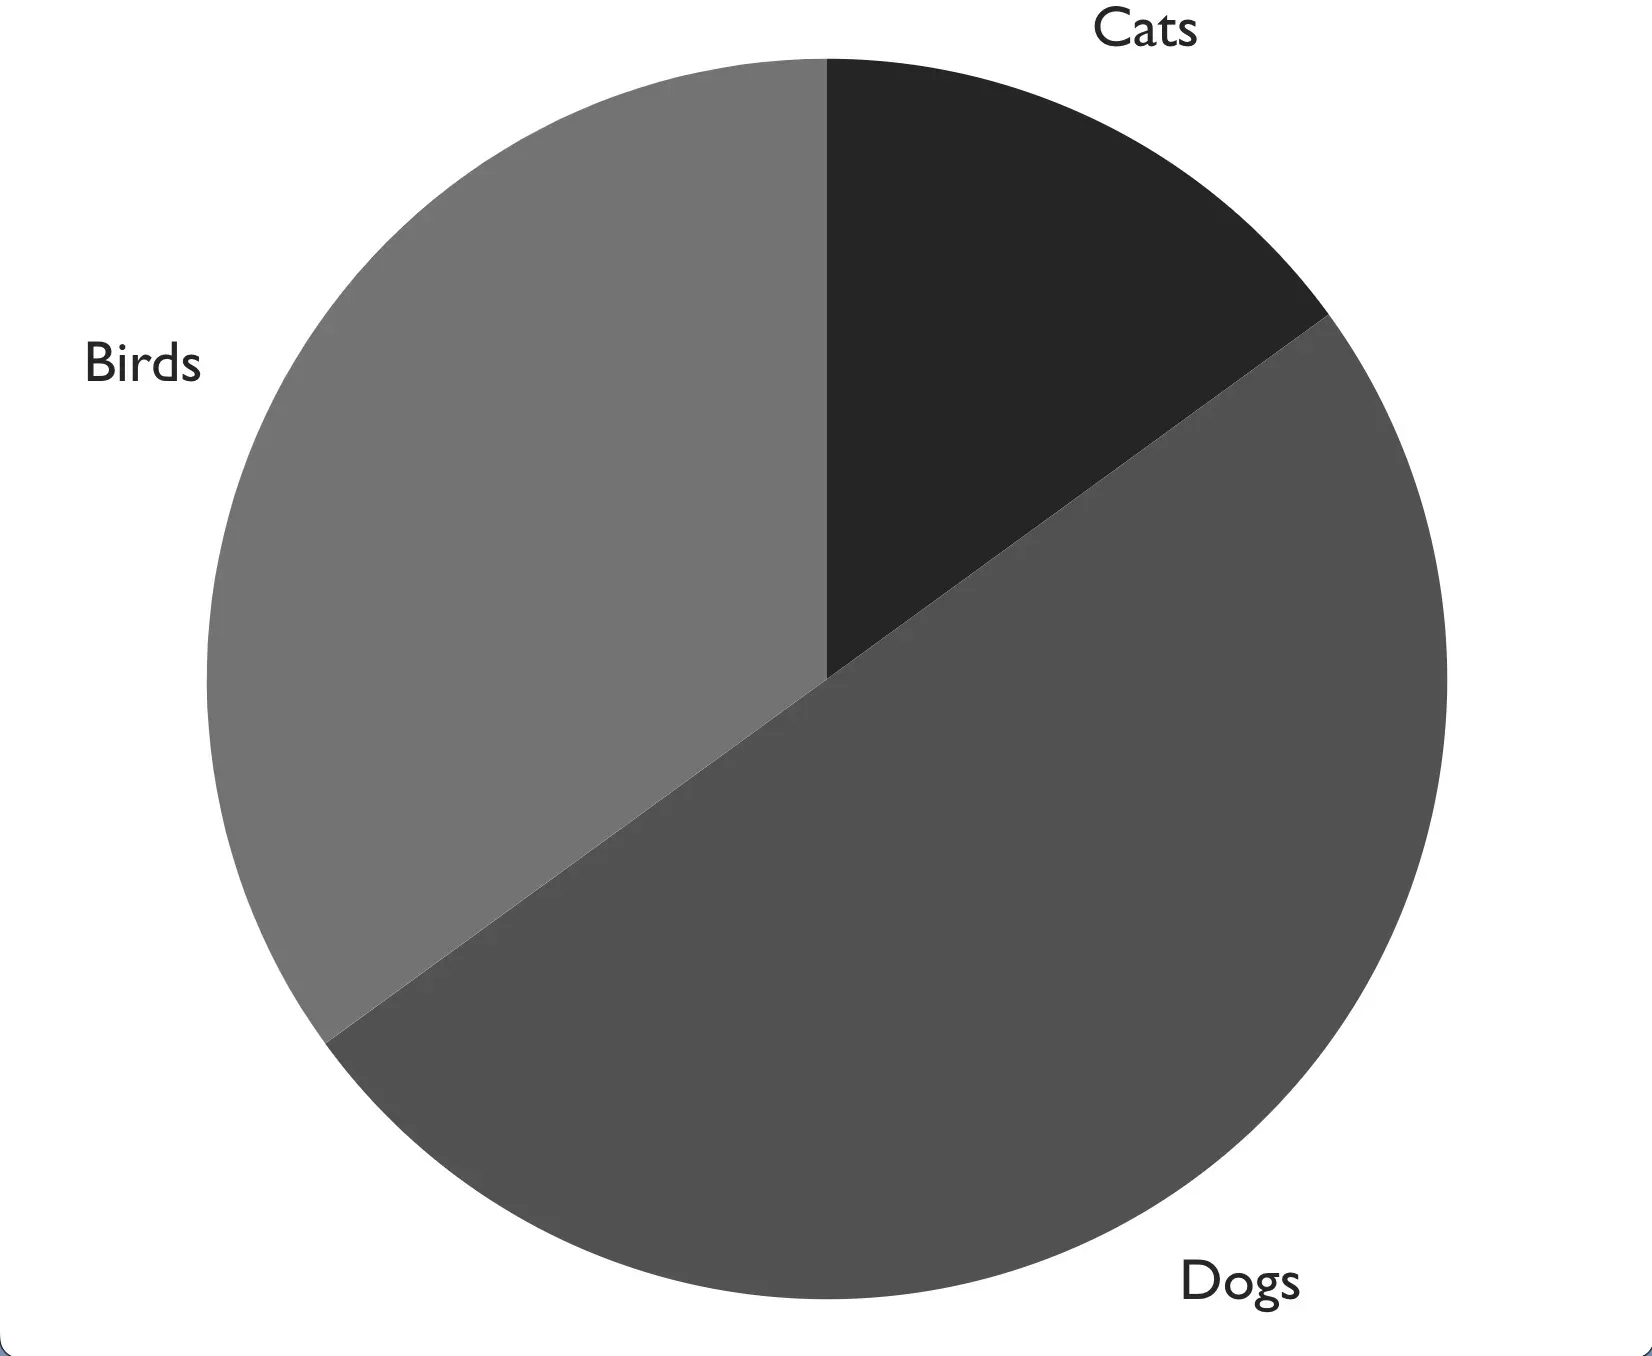
Creating your first Victory component is a straightforward process. Let's take the example of a VictoryPie component. The VictoryPie component renders a pie chart that can be easily customized and integrated into your app.
<VictoryPie data={[ { x: "Cats", y: 35 }, { x: "Dogs", y: 40 }, { x: "Birds", y: 55 } ]} />
This snippet illustrates how you can render a simple pie chart with Victory. It demonstrates the library's commitment to providing composable React components that facilitate building interactive data visualizations with minimal code.
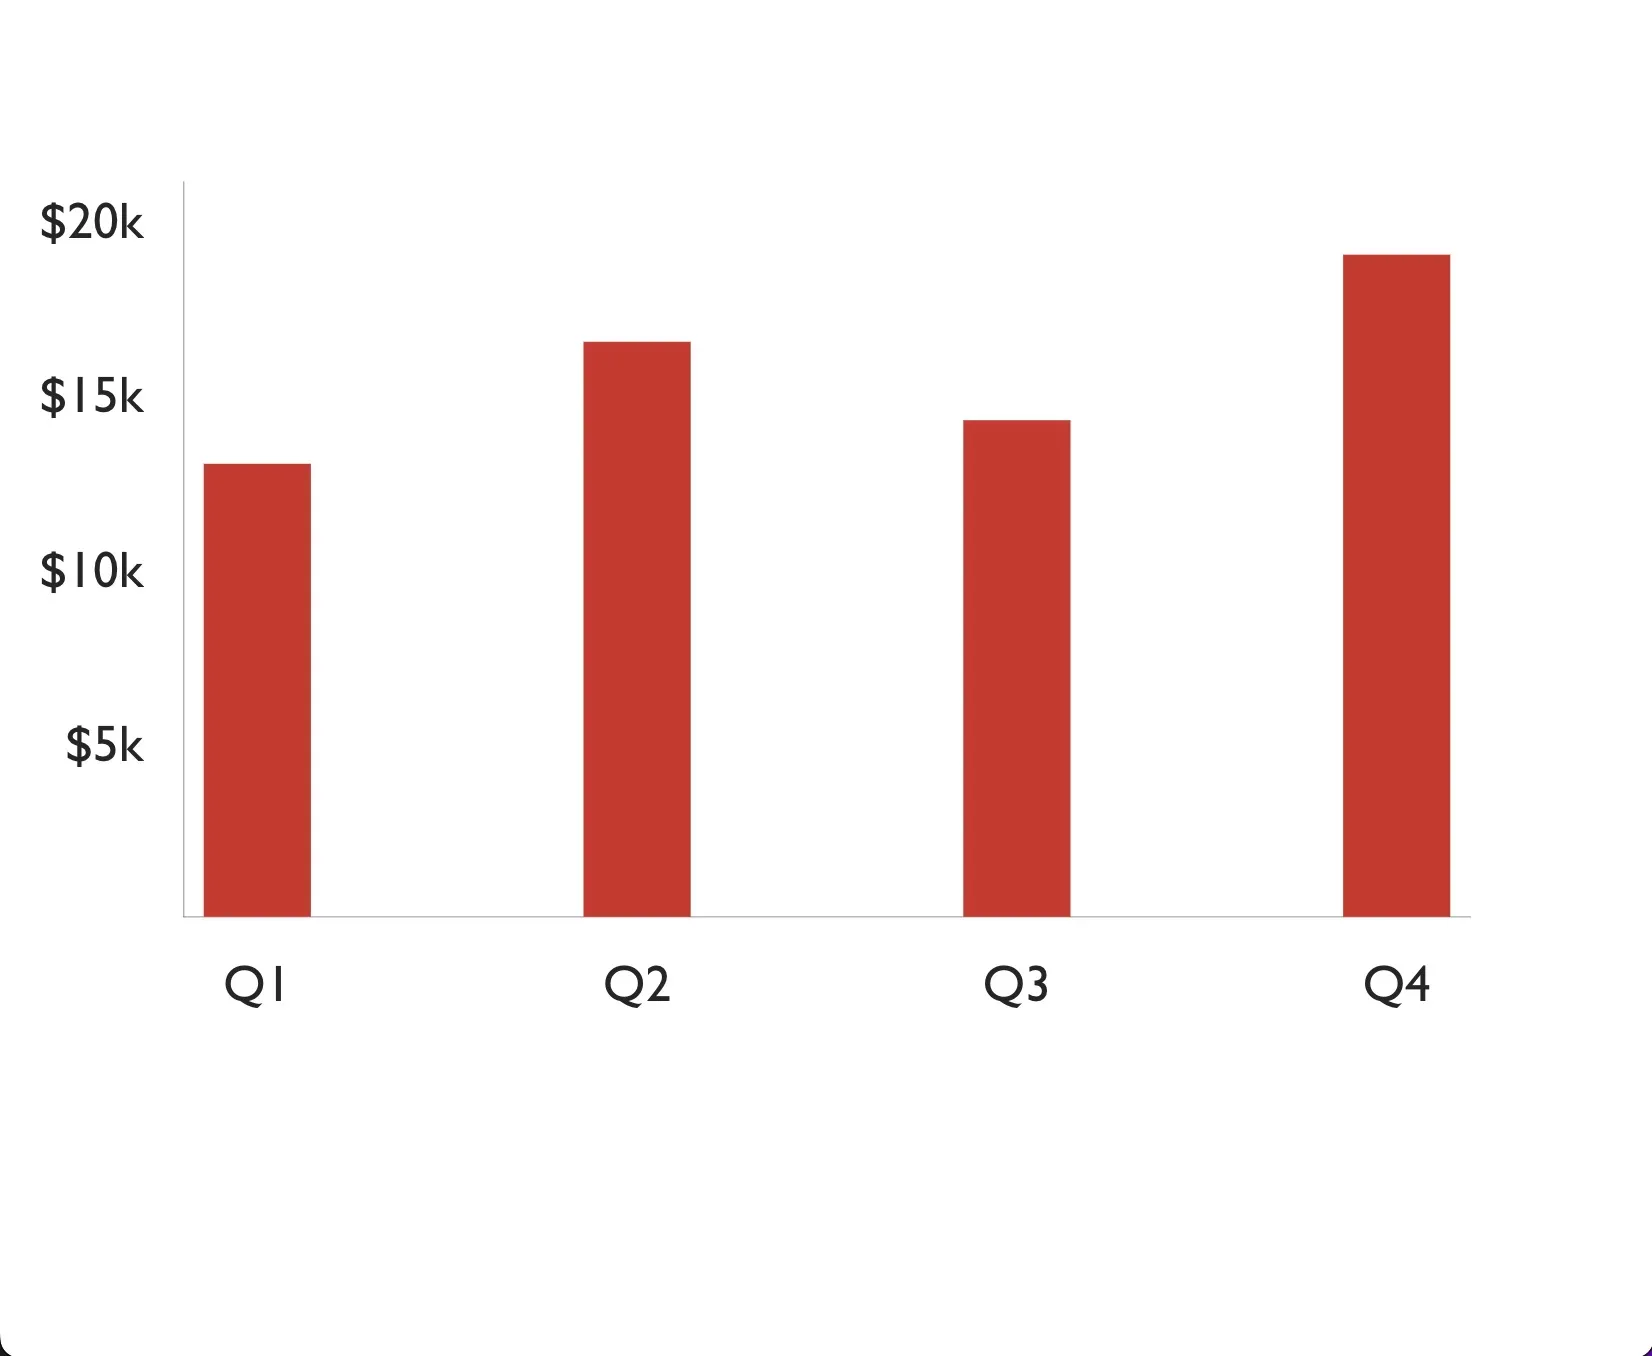
Victory's true strength lies in its flexibility and the breadth of its charting capabilities. Beyond simple pie charts, Victory enables the development of more complex and interactive data visualizations. For instance, combining the VictoryChart, VictoryAxis, and VictoryBar components allows for creating detailed bar charts.
This example showcases the modularity of Victory, where each component serves a specific function, contributing to the overall visualization. It reflects the library's design philosophy of building interactive data visualizations through composable React components.
Victory Native leverages the identical API of Victory, enabling developers to craft compelling data visualizations for mobile apps. It's a testament to the versatility and robustness of Victory, extending its capabilities beyond web applications to mobile platforms.
To integrate a VictoryPie component in a React Native app, the process remains remarkably similar to that in a web context, underscoring the identical API between Victory and Victory Native.
This example not only illustrates how to add Victory to a React Native project but also highlights the ease of transitioning between web and mobile development within the Victory ecosystem.
Victory Charts offers a powerful yet accessible pathway for developers to incorporate rich, interactive data visualizations into their React and React Native projects. With its composable components, identical API across platforms, and extensive documentation, Victory empowers developers to bring their data to life. Whether you're building a web application with React DOM or a mobile app with React Native, Victory provides the tools to create engaging and informative visualizations that elevate your projects.
import React from 'react';
import { VictoryChart, VictoryBar, VictoryAxis } from 'victory';

const data = [
  { quarter: 1, earnings: 13000 },
  { quarter: 2, earnings: 16500 },
  { quarter: 3, earnings: 14250 },
  { quarter: 4, earnings: 19000 }
];

function SalesBarChart() {
  return (
    <VictoryChart domainPadding={20}>
      <VictoryAxis
        tickValues={[1, 2, 3, 4]}
        tickFormat={["Q1", "Q2", "Q3", "Q4"]}
      />
      <VictoryAxis
        dependentAxis
        tickFormat={(x) => `$${x / 1000}k`}
      />
      <VictoryBar
        data={data}
        x="quarter"
        y="earnings"
        style={{ data: { fill: "#c43a31" } }}
      />
    </VictoryChart>
  );
}

export default SalesBarChart;
import React from 'react';
import { VictoryChart, VictoryLine, VictoryTheme } from 'victory-native';

const temperatureData = [
  { day: 'Monday', temperature: 22 },
  { day: 'Tuesday', temperature: 24 },
  { day: 'Wednesday', temperature: 19 },
  { day: 'Thursday', temperature: 25 },
  { day: 'Friday', temperature: 18 },
  { day: 'Saturday', temperature: 20 },
  { day: 'Sunday', temperature: 23 }
];

function TemperatureLineChart() {
  return (
    <VictoryChart theme={VictoryTheme.material}>
      <VictoryLine
        data={temperatureData}
        x="day"
        y="temperature"
        style={{
          data: { stroke: "#2196F3" },
          parent: { border: "1px solid #ccc"}
        }}
      />
    </VictoryChart>
  );
}

export default TemperatureLineChart;